
They are posted here primarily for my use as I tend to lose them and forget which system
I have developed them for or on.
I have posted some of my larger projects on GitHub
1.) Minimum of a function with two variables
2.) Compute Binary Coefficient with GMP
3.) Model Rocket Flight
4.) Least Squares Curve Fitting
5.) Measure Machine Precision
6.) MPI Timers
7.) Non-Uniform Memory Access
8.) MPI and OpenMP Sorting example
9.) Parallel Artificial Neural Network
10.) Particle Simulation using MPI
11.) Filesystems Performance
Minimize a function of 2 variables
Below is a code that finds the minimum value of this, rather nasty, function:

Here is what the function looks like over the domain x=[-2,2], y=[-2,2]:
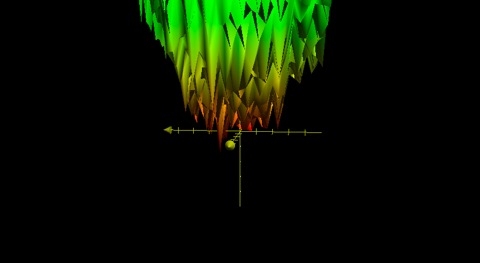
Here’s the code that provides the minimum solution (z) at x and y points with 16 digits of accuracy.
findmin
Binary Coefficient with GMP
Solves the “n choose k” problem with high accuracy sing the Gnu Multiple Precision Library to get the binomial coefficient or “n choose k” where you choose k items from a total of n. This applies to an uncanny amount of decisions. For example if I want 2 toppings on a pizza where I am offered 8, I would have 28 total combinations, or possible pizza’s I can order. Mathematically this would look like :
Example:
Papa Johns Pizza has 13 toppings , I could use this program to tell me how many 2 topping pizzas could be ordered.
./bin_coeff 13 2
13!/((13-2)!*2!) = 78
bin_coeff
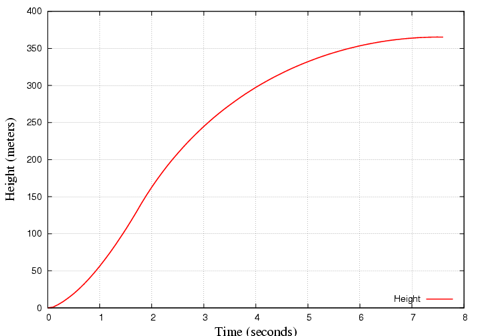
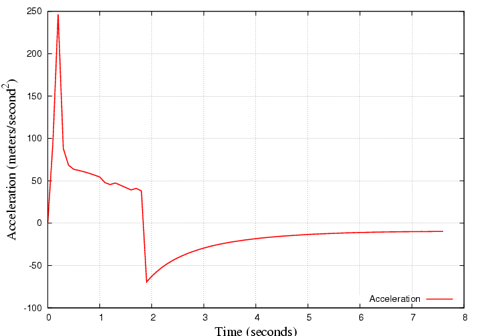
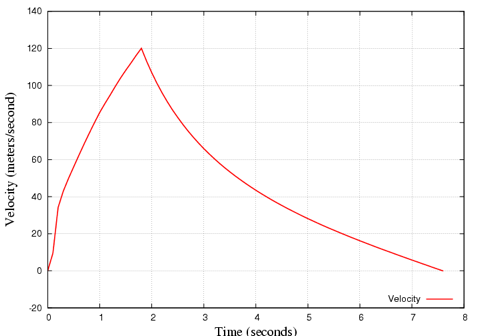
Rocket Flight
Below is a simulation of an ESTES III rocket flight, which goes up to about 360m. This may also be useful to determine your search area for recovery.
How large and how much thrust is required for your engine to break the sound barrier?
What dimensions are needed to reach earth’s escape velocity and get into orbit (~7 miles per second, below 9km), that’s 34 times the speed of sound!?
Results from an Estes III:
Find out more about rockets at NASA.
Least square fit
least_square_fit
Machine Precision
Find machine epsilon “eps” and the largest and smallest floating point numbers run on the machine:
output:
type float has about six significant digits
eps is the smallest positive number added to 1.0f that changes 1.0f
type float eps= 5.960464478E-08
type float small= 1.401298464E-45
this could be about 1.0E-38, above shows good IEEE floating point
type float large= 1.701411835E+38

type double has about fifteen significant digits
type double eps= 1.11022302462515654E-16
type double small=4.940656458E-324
this could be about 1.0E-304, above shows good IEEE floating point
type double large=8.988465674E+307
find_eps
MPI timers for measuring total time spent in MPI per process, also reports the fastest and slowest process.
Here is a timing library that uses MPI to time events before, during and after job startup and execution. These codes have been used on some of the largest computers on the planet and have been run with jobs using tens of thousands of nodes.
To compile:
mpicc -o myapp myapp.c timer_c.c
To run: Run like you would normally
The output is a report like the following, for a 32 core job with 8 cores per node:
++++ TIMER ++++:  *** Begin Timing Report ***
 ++++ TIMER ++++:
 ++++ TIMER ++++:
 ++++ TIMER ++++:  Max MPI_Init timer val =      1302705360.308043 at rank      17
 ++++ TIMER ++++:  Min MPI_Init timer val =      1302705359.990557 at rank      20
 ++++ TIMER ++++:  Avg MPI_Init timer val =      1302705360.008024
 ++++ TIMER ++++:
 ++++ TIMER ++++:  Max MPI_Fin  timer val =      1302705365.750423 at rank       0
 ++++ TIMER ++++:  Min MPI_Fin  timer val =      1302705363.805567 at rank       2
 ++++ TIMER ++++:  Avg MPI_Fin  timer val =      1302705364.023629
 ++++ TIMER ++++:
 ++++ TIMER ++++:  Max Fin-Init timer val =               5.759574 at rank       0
 ++++ TIMER ++++:  Min Fin-Init timer val =               3.799549 at rank      23
 ++++ TIMER ++++:  Avg Fin-Init timer val =               4.015605
 ++++ TIMER ++++:
 ++++ TIMER ++++:  Max Fin - Min Init val =               5.759866
 ++++ TIMER ++++:  Min Fin - Max Init val =               3.497524
 ++++ TIMER ++++:
 ++++ TIMER ++++:     Rank           Elapsed Time               MPI_Init           MPI_Finalize       Processor Name
 ++++ TIMER ++++:        0               5.759574      1302705359.990849      1302705365.750423       intel01
 ++++ TIMER ++++:        1               3.814418      1302705359.991311      1302705363.805729       intel02
.
.
.
++++ TIMER ++++:       30               3.849024      1302705359.990912      1302705363.839936       intel06
++++ TIMER ++++:       31               3.841840      1302705359.990923      1302705363.832763       intel06
++++ TIMER ++++:
++++ TIMER ++++:  TIMER Overhead (inside MPI) from Rank 0     =           0.002057
++++ TIMER ++++:  TIMER and MPI_Finalize Overhead from Rank 0 =           0.062166
++++ TIMER ++++:
++++ TIMER ++++:
++++ TIMER ++++:  *** End Timing Report ***
Here is the code in C:
MPI_timer
And in Fortran90:
MPI_timer
A simpler timer just for getting startup and shutdown times from MPI_Init() and MPI_Finalize():
simple_mpitimer
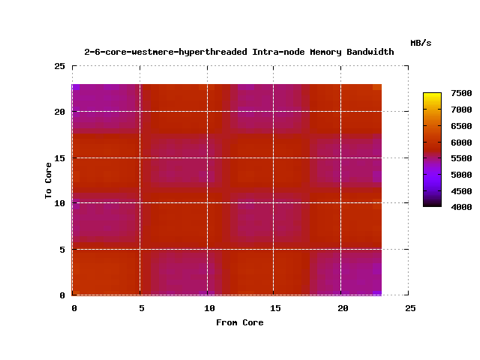
Non Uniform Memory Access
Sometimes we can see hardware errors using software, the images below represent running the numa.c code on a healthy Nehalem node and a “sick” node. We then took the processor out of the bad node and we saw that there was a bent pin, although the node was reporting full functionality to the system.
Above we see the Intranode Memory bandwidth for a hyperthreaded Nehlem 8 core(16 w/HT)
Above is the intranode memory bandwidth for “healthy” Nehalem 8 core hyperthreaded node
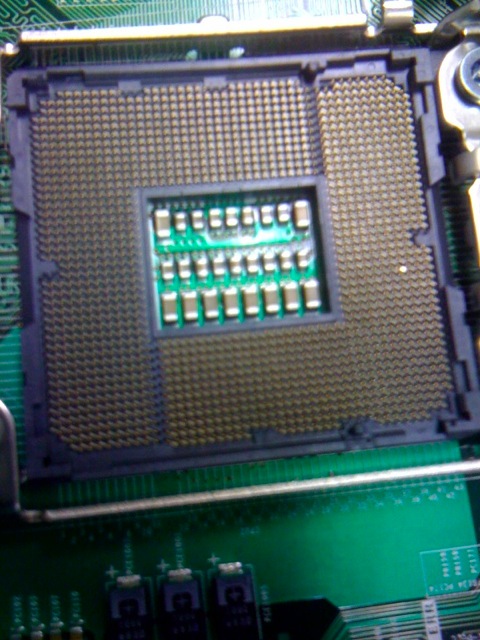
See the bent Pin!
Software can be used to debug Hardware QED.
For numa nodes use this to see intra node memory bandwidth on multicore processors. The code allocates memory for a single core, then measures the time to read this memory from every other core on the processor. This should give a clear picture of the costs of accessing memory between chips on multicore multiprocessor systems.
numa
To create a .png heat map with Gnuplot use the following script where the argument is the file created by numa.C:
To execute:
./plotnuma.sh filename.txt
#!/bin/sh
gnuplot -persist << EOF
set title "$1 Intra-node Memory Bandwidth"
set pm3d at b
set view map
set xlabel "From Core"
set ylabel  "To Core"
set dgrid3d 8,8
set grid
set output "$1.png"
set term png
splot "$1" u 1:2:3 w pm3d t "MB/s"
!display $1.png
EOF
This was run on an Intel Westmere node with 2 6-core processors. We can see 4.5 GB/sec off chip and 6.4 GB/sec when the memory
is on the chip, that’s a ~42% performance difference!
Parallel Neural Network
Simple feed-forward ANN that uses back propagation.
Code coming soon!
OpenMP + MPI
Using MPI and OpenMP working together to do a sort, there is no communication between tasks.
The graph below shows the performance when using OpenMP and MPI to quicksort 1 Million numbers in ascending and descending order.
This was run on 8 Nehalem nodes with 8 cores each with one OpenMP thread per core. So each node ran 1 MPI process with 8 OpenMP threads per node.
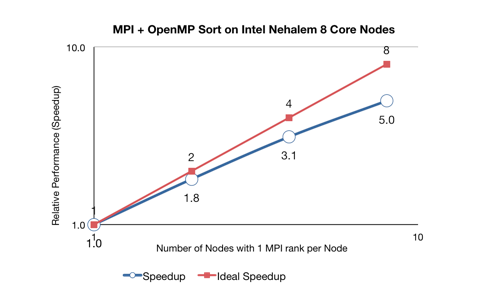
The times:
[MPI ranks]  [time (s)]
      1            20.9
      2	           11.6
      4	           6.7
      8	           4.2
the openmp and MPI code (skeleton)
openmp_mpi_work
the busy work code with cpu_test()
cputest
Particle Simulation using MPI
Here is an animation with 50 particles run for 35 time steps on 4 nodes. Each color represents the node used in calculating the velocities. A particle starting at position 0.75,0.75 has 10x the mass of the others, which explains the grouping behavior. On the right we see 3000 particles over the same period, but with interesting results.
Filesystem Performance
Below is a link to what was 3 active GPFS filesystems on a production cluster. I had a 5 minute cron job that reads and writes a 1GB file
from all of the different processor types on the system. The plot dispays the measured bandwidth at those intervals, with the mean and 2 standard deviations.
We can see a performance taper off over time, which is most likely due to increased overall disk usage. The gaps are scheduled downtimes, we can see one particular downtime had an affect on all performance.
Filesystem Performance