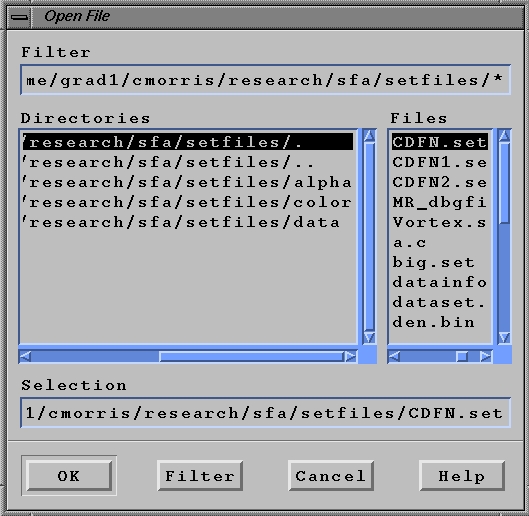
Figure 1a: Open File Dialog
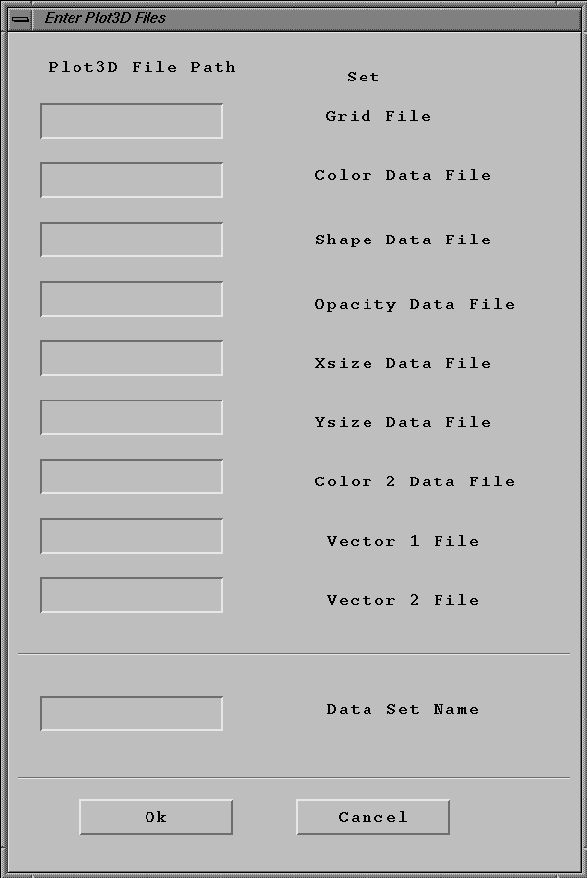
Figure 1b: Open Plot3D File Dialog
OVERVIEW
SFA was designed to give the user many options for displaying sets of data. Initially, the user can choose which sets are to be opened, edit the initial mappings of the data variables to various glyph attributes to fit his/her liking, and then save the data sets with these changes to view at a later time.
Furthermore, while the
data is displayed, the user can choose whether to view the data as vectors
or a variety of glyph shapes, scale the vectors or glyph shapes, adjust
what intervals of the data are to be drawn, and the color maps or alpha
maps that will be used to display the glyphs. In addition, with the use
of Crystal Eyes glasses, the data set can be viewed in stereo to obtain
a better perceptual understanding of the data. The functionality of SFA
and the many options that are provided are explained in detail below.
NOTE: For all of these menu items,
if a menu is open, typing the letter that is underlined for a given
option will have the same effects as selecting that option with the mouse.
File
Open... : Produces a
file dialog menu that allows the user to load a set file from a directory.
(See Figure 1a)
Open Plot3D... : Produces a dialog that
allows the user to load Plot3D datasets and immediately map
them to one of SFA's dimensions. (See Figure 1b)
Close: Allows the user to close the setfile(s) designated in the Data Set Box (described later).
Save: Saves the currently selected data set and it's current mappings as a set file.
Save As... : Allows the user to name and specify where the selected data set will be saved as a set file.
Quit: Terminates SFA.
Figure 1a: Open File Dialog
Figure 1b: Open Plot3D File Dialog
Edit
Mappings... : Produces a menu that will
allow user to decide which data variables contained in the
selected set file will be mapped to
the following attributes:
Xpos - position in grid along x-axis
Ypos - position in grid along y-axis
Zpos - position in grid along z-axis
Color - color as designated by specified color map
Opacity - transparency as designated by specified alpha map
Xsize - scale in x direction or, if vectors are selected (described
later),
the position in the grid, along the x-axis, of the head of the vector,
as determined by a vector map
Ysize - same as Xsize except in y direction
Zsize - same as Xsize except in z direction
Shape - interpolation between shaped if interpolated shapes are
selected in Shape
Box (described later). If interpolated shapes are not selected, the shape
will
always remain constant.
SFA has the capability to display two vectors at once. The following mappings
are
for the second vector.
Xvect - the position in the grid, along the x-axis,
of the head of the second vector,
as determined by a vector map
Yvect - same as Xvect except in y direction
Zvect - same as Xvect except in z direction
Color 2- color of second vector as designated
by specified color map
By selecting the OK button, the mappings will be applied and the
window closed.
By selecting the Apply button, the mappings will be applied but,
the window will remain
open. Selecting the Cancel button will close the window and not
apply any mappings.
(See Figure 2)
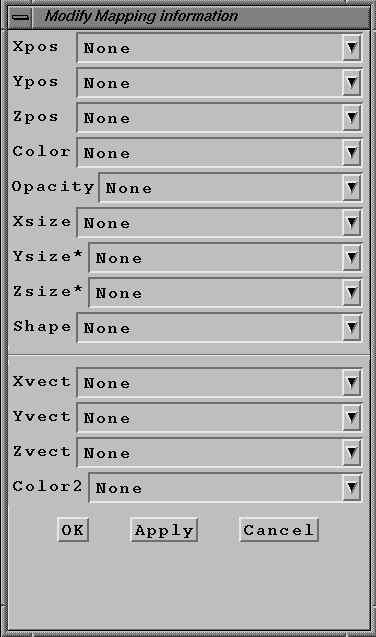
Figure 2: Edit Mappings Menu
Load Opacity/Color(2) Maps...: Allows the
user to set the color and alpha maps in SFA by supplying
a menu of predefined color and alpha maps for the user to choose
from.
Step Size...: Produces a menu that will
allow the user to designate which glyphs will be drawn in the
x, y, and z directions. For example, if 4 is selected in the X box, every
fourth glyph in the
x direction will be drawn. The buttons (OK, Apply, and Cancel) work the
same as in the
Mappings menu. (See Figure 3, 4. and 5)
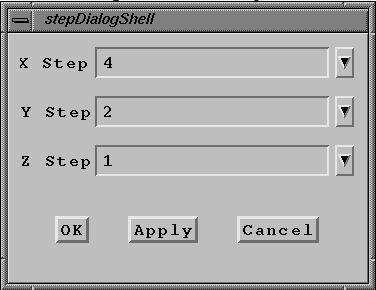
Figure 3: Step Size Menu
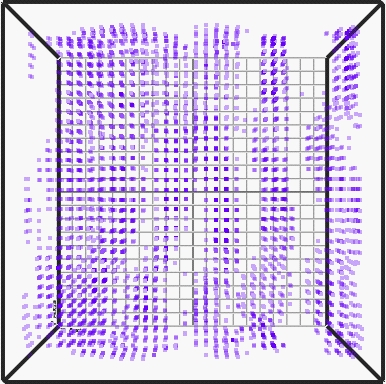
Figure 4: Data With Every Glyph Drawn
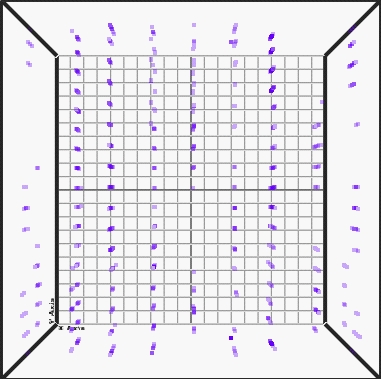
Figure 5: Data with a Step of 4 in the X Direction and of 2 in the Y Direction
Filter Data: Displays a large menu from which the user can use
a combination of scrollbars and
toggle buttons to filter out the data, from each dimension, within or without
the
designated range.
Preferences: A dialog is displayed(See Figure 6) that allows the user to designate:
1) If the bounding box is to be displayed
2) If the Packed Glyph (i.e. cached) data is to be used.
3) The contour level
4) The number of glyphs to be drawn. (Currently, the default is 5000)
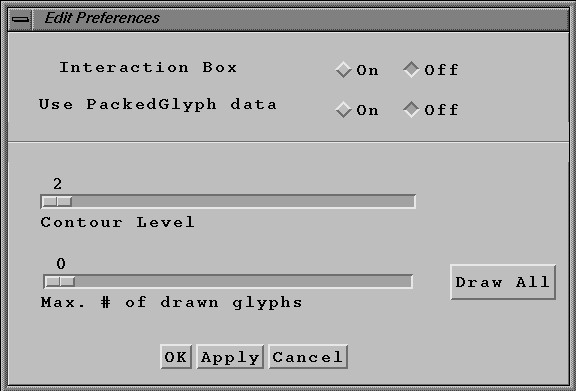
Figure 6: The Preferences Dialog
Plate Index: An index is displayed (See Figure 7) that
allows the user to designate which mapping (and
its corresponding dimension) will be visible in the contour/3D texture
plate. Currently,
the default is set to which ever dimension is mapped to Xsize.
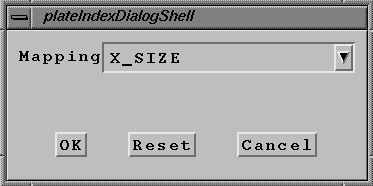
Figure 7: Plate Index Dialog
Show Toolbar: Hides/shows toolbar underneath pulldown menus.
Stereo Parameters...: Produces a window
that allows the user to select the Convergence and Eye
Separation of the two buffers that are created when Stereo is selected.
As of 5/24/00, this is not fully operational.(See Figure 8)
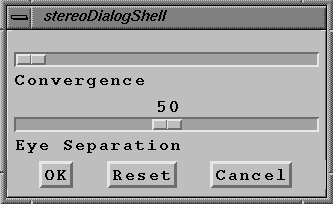
Figure 8: Stereo Dialog
Stereo On: Displays SFA in stereo.
Stereo Off: No longer displays SFA in stereo.
Scale Glyphs/Vector 1, Scale Vector 2...:
Displays a scale bar that allows the user to scale the size of
both glyphs and both set of vectors within SFA. The user is
allowed to scale from 0 to 1000% of the original scale.
(See Figure 9)
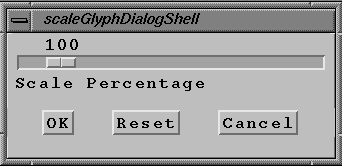
Figure 9: Scale Dialog
Telltale
Connect: Displays a dialog that prompts
the user for the Telltale server name and port to which
SFA will connect to and, also, the dataset from which SFA will search for
documents.
Query: The user is prompted for five strings
that Telltale will query the specified dataset for. Initially,
these query strings can be mapped to the position of the glyph, as well
as the shape and color.
Subset
Cubic Subset: The user will be able to sweep out a subset using a rectilinear box. (See Figure 10a)
Sphere Subset: The
user will be able to sweep out a subset using a sphere.(See Figure 10b)
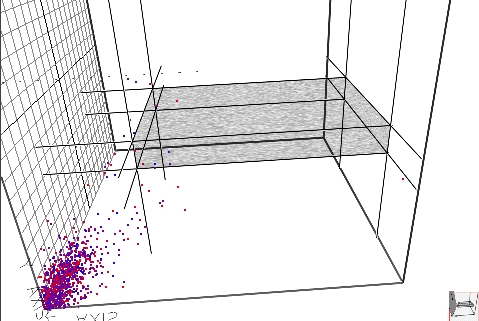
Figure 10a: Cubic Subset Box
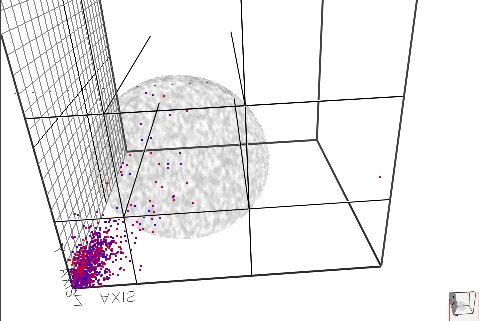
Figure 10b: Subset Sphere
DATA SET BOX
Displays
the data sets currently loaded into SFA. By selecting on a data set and
highlighting it, the
data set will be displayed
in the bounding box and all operations subsequently performed will be
applied to this dataset.
TYPE BOX
Allows
the user to designate whether scalar glyphs, vectors (See Figure 11),
or a combination of two
vectors and a glyph
(multi-glyph), for each point, will be drawn.
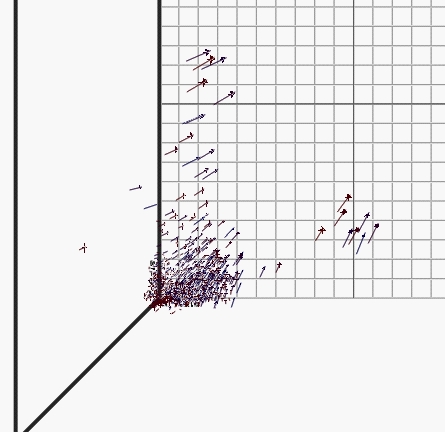
Figure 11: Data Represented by Vectors
GLYPH BOX
Allows the user to pick which shape will be displayed as the scaler glyphs. The shapes currently available are:
Non-interpolated Shapes
Point/Dot (See Figure 12)
Sphere (currently draws discs)
Circle (currently draws triangular "discs")
Cube
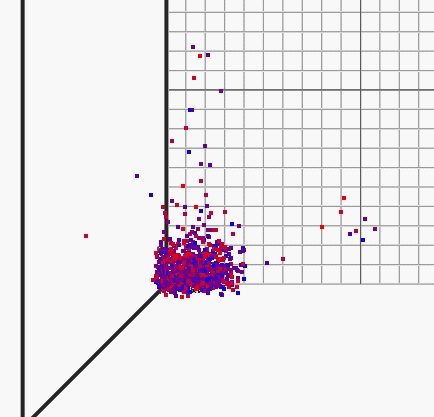
Figure 12: Data Represented by Points/Dots
Interpolated Shapes
Pyramid to Cube
Pyramid to Octahedron
Turbulated Cube
Octahedron to Cube
Superellipsoid (See Figure 13)
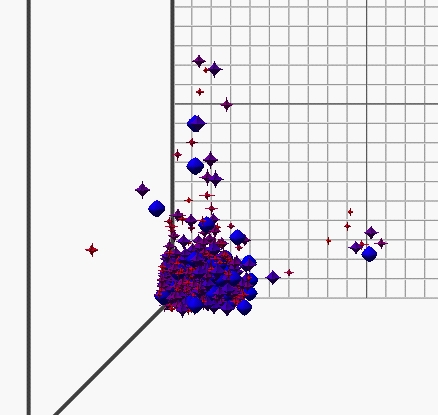
Figure 13: Data Represented by the Interpolated Superellipsoids
OPACITY BUTTON
Toggles between displaying the glyphs with or without
the designated opacity map.