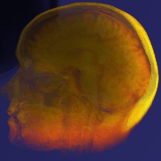
 This image was rendered using
realistic gas based volume rendering. No Segmentation has been
performed on this image. The image does feature accurate shadowing and
illumination. Coloring has been added to enhance features.
Brain MRI data  This image was rendered using
realistic gas based volume rendering. No Segmentation has been
performed on this image. The image does feature accurate shadowing and
illumination. Coloring has been added to enhance features.
Brain MRI data 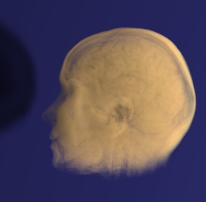 This image was rendered using
realistic gas based volume rendering. No Segmentation has been
performed on this image. The image does feature accurate shadowing and
illumination. Rendered to show both skin and brain.
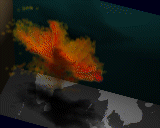
This image is a visualization of a reconstruction of the sulphur dioxide cloud from the Mt. Pinatubo eruption. The data was reconstructed from TOMS satellite data and wind flow models.
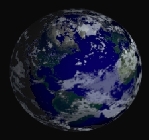
This image is from the animation used to launch the GLOBE project. It was done using Wavefront software by Cindy Starr, myself, and two students from the UMBC IRC center. It aired on several national news broadcasts. More details on the project.
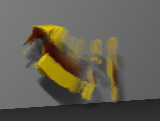
This image from a 1994 animation shows the flow between two blades of a turbo-jet compressor. The opacity is determined from the pressure and the color is dtermined from the temperature (yellow = highest temperature).

This image shows the time varying flow from a two-dimensional square jet. This image features atmospheric based shadowing, illumination, and atmospheric attenuation of the flow.
This image (to be added) of Ocean Levitus data featuring the warm water equatorial flows was created from data supplied from NASA Goddard SPace Flight Center.

This image shows an example of glyph based information visualization. For information follow the above link.